Some definitions and nomenclature relevant to light & the biosphere.
This includes a summary of the two systems of measurement; photometric, and radiometric (with some of the differences between astronomy, biology and physics), and respective nomenclature.
Algae: The largest and most complex marine algae are called seaweeds, while the most complex freshwater forms are the Charophyta, a division of algae that includes Spirogyra and the stoneworts.
Blue-green algae (also known as cyanobacteria) are the only group of algae to be toxic in freshwaters. They are microscopic bacteria living in water and are capable of photosynthesising which is why they are often called algae. Though microscopic, when they form colonies and accumulate together they can become visible to the naked eye. Cyanobacteria, which are prokaryotic organisms that carry out oxygenic photosynthesis, occupy many environmental conditions, including fresh water and marine environments.
Marine algal blooms fall into the classes of:
- BACILLARIOPHYCEAE (diatoms)
- DINOPHYCEAE (dinoflagellates)
- PRYMNESIOPHYCEAE (golden–brown flagellates)
- CHRYSOPHYCEAE (golden–brown algae)
- RAPHIDOPHYCEAE (chloromonads)
- DICTOCHOPYCEAE (silicoflagellates)
- CYANOPHYCEAE (marine blue–green algae)
Marine algal blooms can appear as red water discolouration’s commonly referred to as ‘red tides’ or a range of other discoloured water, from green, yellow and brownish to an oily or milky appearance. These algal blooms are commonly mistaken for sewage or some other form of pollution. Other blooms can show no discolouration but be highly toxic at low levels.
Algae tend to grow very quickly under high nutrient availability, but each alga is short-lived, and the result is a high concentration of dead organic matter which starts to decay. The decay process consumes dissolved oxygen in the water, resulting in hypoxic conditions. Without sufficient dissolved oxygen in the water, animals and plants may die in large numbers.
Harmful algal blooms (HABs) have been observed to cause adverse effects to varying species of marine mammals and sea turtles, with each presenting specific toxicity-induced reduction in developmental, immunological, neurological, and reproductive capacities.
Examples of common harmful effects of HABs include:
1. The production of neurotoxins which cause mass mortalities in fish, seabirds, sea turtles, and marine mammals.
2. Human illness or death via consumption of seafood contaminated by toxic algae.
3. Mechanical damage to other organisms, such as disruption of epithelial gill tissues in fish, resulting in asphyxiation.
4. Oxygen depletion of the water column (hypoxia or anoxia) from cellular respiration and bacterial degradation.
Aquatic environments are in three broad categories, namely, fresh water, coastal and deep sea. Coastal habitats have a water column down to the continental shelf and deep sea is all areas where the water column is deeper that the edge of the continental shelf.
Control is the immediate mechanisms of behaviour such as perception of external stimuli.
Diapause is arrested development combined with physiological change and arrested development does not necessarily change when factors become more favourable but require physiological stimuli to be triggered before continuing.
Fauna
Subdivisions relevant to aquatic fauna):
Megafauna: large animals of any region or time. In this environment that includes pelagic fish, reptiles and mammals.
Cryofauna: are animals that live in, or very close to, ice.
Infauna: benthic organisms that live within the bottom substratum of a body of water, especially within the bottom-most oceanic sediments, rather than on its surface. In general, infaunal animals become progressively smaller and less abundant with increasing water depth and distance from shore.
Epifauna: aquatic animals that live on top of the sediment surface at the seafloor.
Macrofauna: benthic or soil organisms which are retained on a 0.3 to 0.5mm sieve.
Meiofauna: small benthic invertebrates that live in both marine and fresh water environments. The term Meiofauna loosely defines a group of organisms by their size, larger than microfauna but smaller than macrofauna, rather than a taxonomic grouping. One environment for meiofauna is between grains of damp sand such as metazoa.
Microfauna: microscopic or very small animals including protozoans.
Subdivisions relevant to terrestrial habitats (http://en.wikipedia.org/wiki/Fauna) include:
Megafauna: large animals of any region or time.
Mesofauna: macroscopic soil invertebrates such as arthropods or nematodes.
Macrofauna: soil organisms which are retained on a 0.3 to 0.5mm sieve.
Microfauna: microscopic or very small animals including protozoans
Fish classification (http://en.wikipedia.org/wiki/Vision_in_fishes)
Pelagic fish “live near the surface or in the water column of coastal, ocean and lake waters”.
Reef fish are associated with coral reefs.
Demersal fish dwell on or near the bottom.
Gelbstoff is coloured dissolved organic matter
Quiescence is when development is slowed or halted until conditions become favourable again.
Lucifugal is a dislike and therefore avoidance of light
Ontogeny is the development of behaviours during the lifetime of the species
Perpetuation is the survival value or selective advantage of a behaviour.
Phylogeny is the evolution of behaviours over very long periods of time.
Phytoplankton encompasses all photoautotrophic microorganisms in aquatic food webs. Phytoplankton or microalgae form the base of the food web upon which nearly all other marine organisms depend. Of the 5000 plus species of marine phytoplankton that exist worldwide, about 2% are known to be harmful or toxic.
(http://en.wikipedia.org/wiki/Phytoplankton). Freshwater phytoplankton species total around 15,000. Phytoplankton is classified based on cell size:
micro-phytoplankton (200-20μm),
nano-phytoplankton (20-2μm) and
pico-phytoplankton (2-0.2μm) – (Vaulot 2001).
Zeitgeber: a cue given by the environment, such as a change in light or temperature, to reset the internal body clock.
Units of measurement
The correct radiometric/photometric definitions (Julian 1985, Björn 2008, Herring Campbell Whitfield and Maddock 1990, Philips Lighting International BV, 1985) lend credibility to any dissertation when relating behavioural effects to electromagnetic radiation spectra.
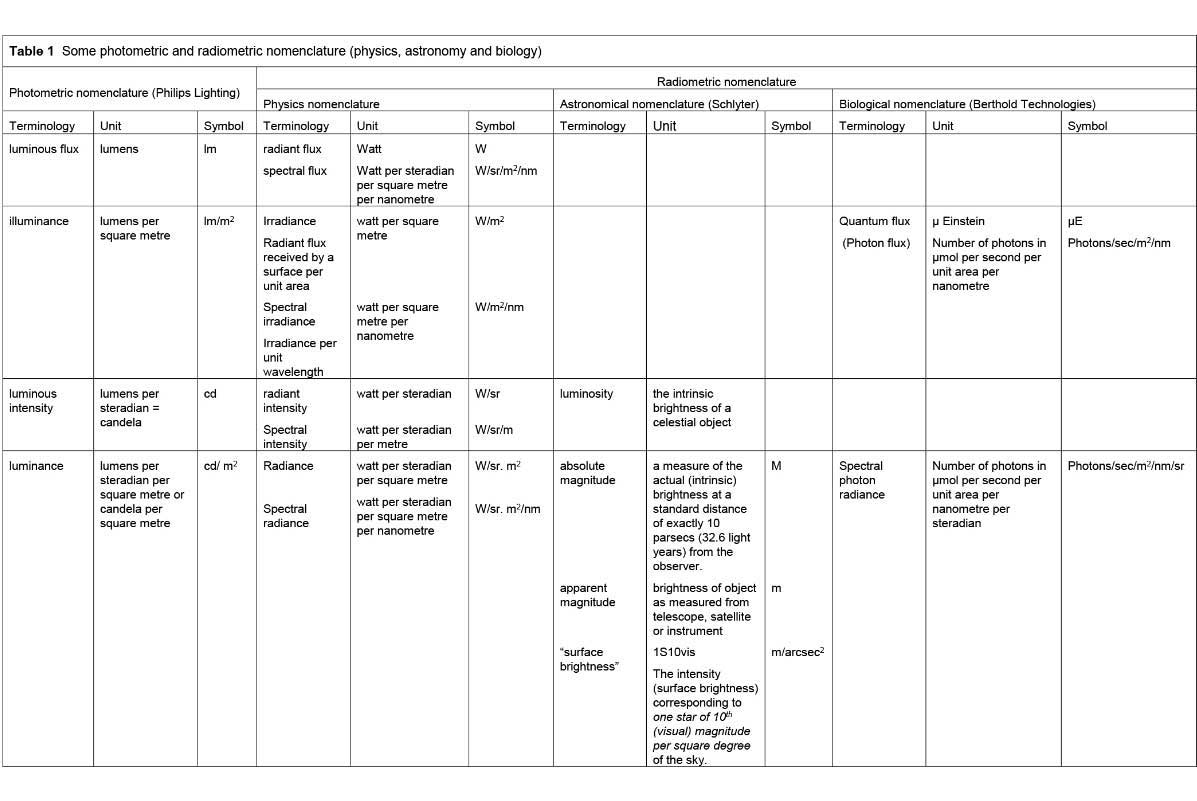
There are two nomenclature systems, photometric and radiometric. The radiometric system generally defines the quantum of energy at each wavelength in a specific section of the electromagnetic spectrum. The radiometric nomenclature is general and applies to all radiant energy although some definitions vary depending on which science is involved (refer Table 1).
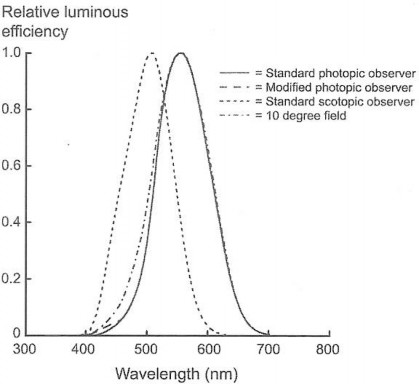
The photometric system is a conversion of the radiometric system absolute units via a defined bell curve function (refer Figure 1) to photometric units. The bell curve function represents an agreed human visual systems response to different wavelengths of energy in the range 380 to 780 nanometres. The bell curves represent the human photopic and scotopic responses, which is when there is sufficient irradiance on receptors to illicit a response from those cones and or rod receptors respectively in the human eye. The reaction of cones in the human visual system determines colour vision. Typically, photopic response is associated with daytime environments or night-time environments where there is sufficient irradiance for cones to respond. This system is the photometric system.
The photometric system therefore only applies where radiant energy is being measured relative to human beings.

Figure 1 CIE Standard Observers (Boyce 2003) p6, where the standard photopic curve is the curve normally used in the conversion of radiometric units to photometric units.
The standard and modified photopic CIE observers have a peak at 555nm (known respectively as the 1924 CIE Spectral Luminous Efficiency Function for Photopic Vision and the 1988 CIE Modified Two degrees Spectral Luminous Efficiency Function for Photopic Vision). The modified function, recognising greater sensitivity at wavelengths below 460nm, is considered important when considering blue band LED.
The 10-degree field was developed in 1964 and represented a larger area of the Fovea in which it was believed cones were sensitive rather than the 1924 research that was based on a 2 degrees field.
The standard scotopic observer has peak sensitivity at 507nm and this function is known as the 1951 CIE Spectral Luminous Efficiency Function for Scotopic Vision, that is, there is insufficient light for activation of cone receptors; only the rod receptors are operating.
A number of existing nomenclature systems are indicated in Table 1:
If there was equal energy at every wavelength in the visible spectral region the human visual system would perceive that there was not as much light in the blue part of the spectrum and considerable light in the green-yellow part of the spectrum with declining definition moving into the red part of the spectrum.
Where the visual system response of any species is different to the human visual system response, under the same conditions, that is, where there was equal energy at every wavelength in the visible spectral region 380 to 780 nanometres, that species may perceive what we know as the blue end of the spectrum, as a scene with much greater radiance due to their enhanced receptivity in that part of the radiometric spectrum.
The astronomic nomenclature system deals with both brightness and distance and the interaction of the two factors using a system of Magnitudes. The brightness that a star or any other celestial body appears to be in space is measured by ‘Apparent Magnitude’. The less bright an object appears, the higher the apparent magnitude. The dimmest objects human eyes can see have an apparent magnitude of approximately 6. Objects with an ‘Apparent Magnitude’ higher than 6 are too dim for the human visual system to detect.
Objects with an apparent magnitude of 1 are bright. Some objects, like the Sun for example, are so bright they have a negative apparent magnitude. The Sun’s apparent magnitude is
-26.7 (refer Figure 2).

Figure 2 Apparent brightness’s of some objects in the magnitude system. The Magnitude system as devised by Hipparchus, a Greek astronomer (150 B.C.E), (Nick Strobel’s course notes, http://www.astronomynotes.com/starprop/s4.htm).
‘Absolute Magnitude’ is a concept used to understand how bright a star really is. The absolute magnitude of an object, such as a star, equals how bright that object would look if it were at a standard distance, that is, 10 parsecs, or 32.6 light years away from the Earth.
The Sun’s absolute magnitude is +4.8 which is different to its apparent magnitude -26.7 as noted above.
The system used in biology relates to the amount of energy that biota requires, responds to or is affected by and therefore involves a quantum of energy at specified wavelengths (photons), effecting an amount of substance measured in moles (unit mol). The mole is used to express the number of atoms, ions, or other elementary entities in a given sample of any substance.

